
Penning acquires Veli’s wealth-management business to launch Penning Wealth Veli’s crypto wealth...
Similarly to crypto traders who use technical charts to help them select commodities and equities to trade, cryptocurrency investors implement crypto charts to make better investment decisions.
Crypto charts refer to graphs illustrating historical price and volume, as well as time intervals of an asset. The charts, which are intended to identify investment possibilities, create patterns based on the historical price movements of the virtual currency.
Therefore, reading crypto charts is among the essential skills to master for successful crypto trading.
Table of contents
As we’ve already mentioned, crypto charts are fundamental for successful and lucrative cryptocurrency trading. To avoid making costly mistakes in the rapidly growing crypto market, it’s necessary to understand what crypto charts are and how they work.
Cryptocurrency charts illustrate the price movements of a particular asset over time. As such, they enable traders to analyze market trends, monitor the performance of their assets, and thus make informed investment decisions.
There are several types of charts — candlestick, bar, and line charts.
Candlestick charts give detailed information about trading activity and market trends. Bar charts give a visual illustration of price movements and trading volumes whereas line charts provide a simple survey of an asset’s price movement over a specified period of time.
To understand how to read crypto charts, you need to be familiar with various indicators implemented for market trend analysis, including relative strength index (RSI), Bollinger Bands, and moving averages.
Traders can decide when to purchase or sell a specific cryptocurrency by evaluating these indicators and trends. It’s crucial to remember, though, that no graph or indicator can accurately forecast the future. To make wise investing decisions, it is vital to combine chart analysis with other types of research and information.
Besides, traders should be familiar with different platforms available for chart analysis such as TradingView and Coinigy, as well as a number of plugins and add-ons which can improve their functioning.
The candlestick chart is among the most widely used chart types for studying cryptocurrency markets. They were initially created in Japan in the 18th century to track changes in rice prices but merchants all over the world adopted them to study price changes in various financial markets.
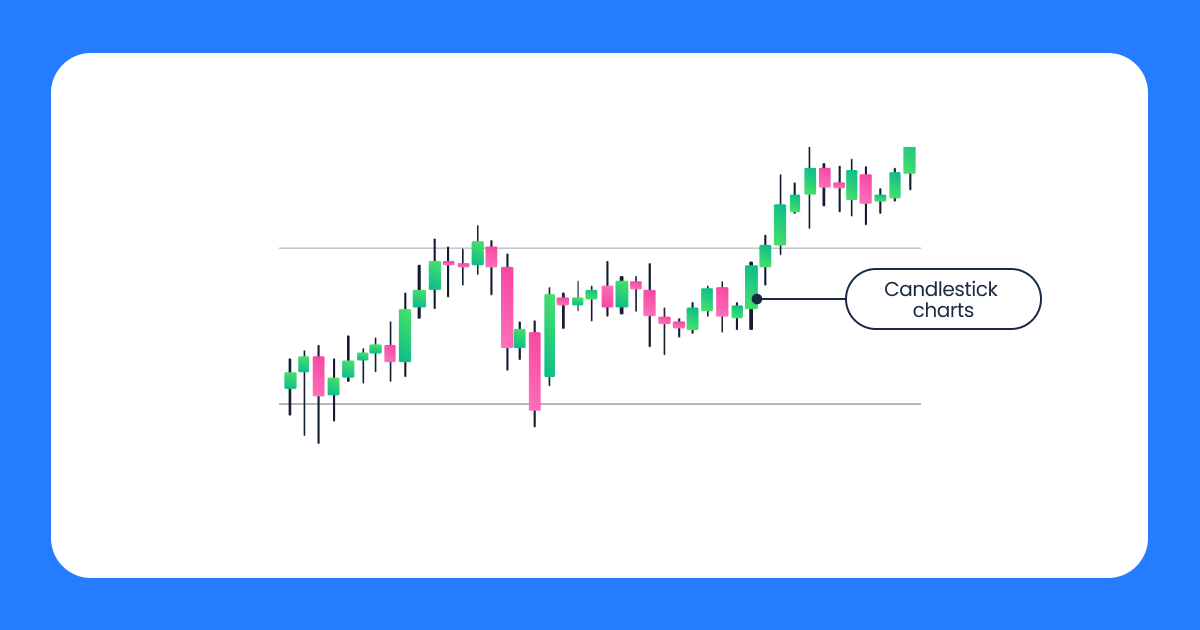
A candlestick chart is made up of several candlesticks, each of which stands for a specific period of time — a day or an hour. A single candlestick consists of a body and a wick. The candlestick’s body represents the opening and closing prices, whereas the wicks stand for high and low prices during that time.
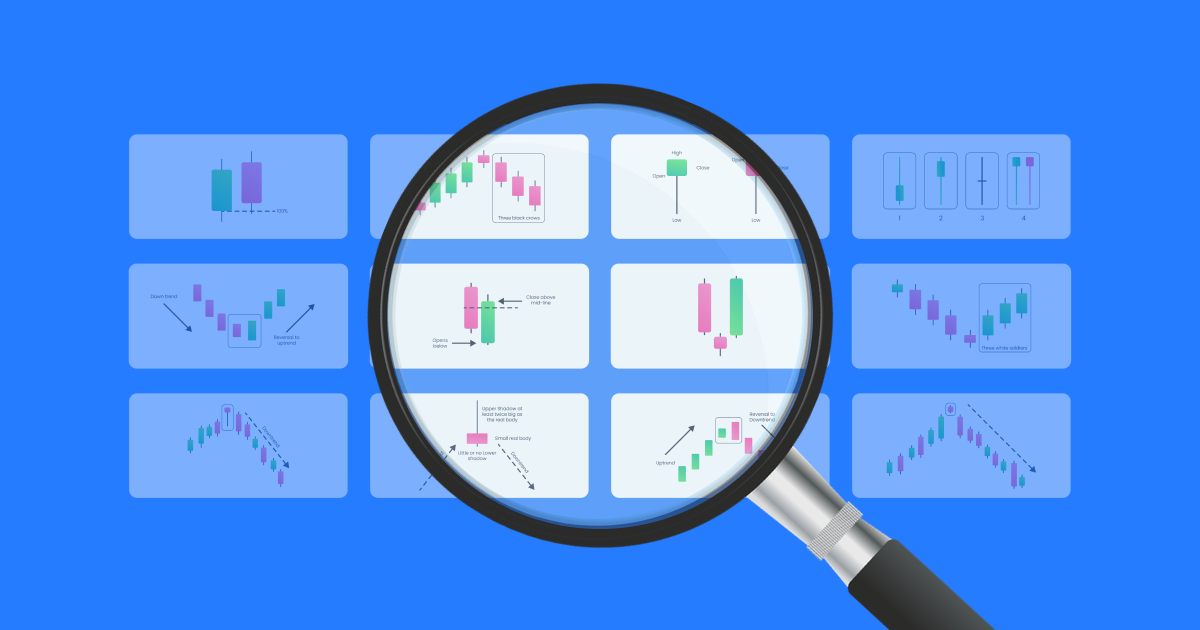
Candlestick charts are frequently used to spot trends and patterns in price changes, which can assist traders in selecting the right assets to purchase and sell.
For instance, a long green candlestick with a little upper wick and no lower wick signifies that there was little seller opposition during the period when the price rose dramatically. For traders, this might be a bullish indicator, pointing to the possibility that the price would climb in the near future.
On the other hand, a long red candlestick with a little lower wick and no upper wick shows that there was minimal buyer support during the period, and the price fell dramatically. Traders may see this as a negative indication, suggesting that the price may drop further soon.
Candlestick charts might also display major levels of support and resistance that traders frequently employ to place orders.
A level of support stands for a price level where buyers are anticipated to enter the market and increase prices. A level of resistance, on the other hand, represents a price level where sellers are predicted to enter the market and decrease prices.
In crypto trading, technical analysis is a common method for examining market trends and predicting future price changes.
Chart patterns, which are one of the essential elements of technical analysis, are visual representations of price changes. Traders typically implement them to spot prospective trading opportunities.
When prices advance in one direction, pause, or move in a reverse direction, a chart pattern is created. Depending on the direction of the market movement, these patterns can be categorized as bullish or bearish.
The former shows a potential increase in prices, whereas the latter indicates a possible drop in the value of an asset.
To understand crypto chart patterns and thus familiarize yourself with technical analysis, it would be wise to know the most common chart patterns used by traders. Those are:
Timeframes are the intervals of time displayed on a cryptocurrency chart. A variety of timeframes, ranging from one minute to one month or more, are available to traders.
Longer durations offer a larger viewpoint, while shorter timeframes offer a more in-depth look of market moves. A short period chart, for example, might be used by traders to spot a short-term trend or momentum, whilst a long time frame chart might reveal long-term market tendencies.
Volume refers to the total amount of cryptocurrency traded during a given time frame. It is a crucial indicator since it conveys data on the potency of a trend.
A strong market trend is frequently indicated by high trading volume, whilst a choppy market may be indicated by low volume. Trading professionals can utilize volume data to support or refute price trends and spot probable price reversals.
Price action is the term used to describe how cryptocurrency prices change over time. It has components like trend lines, chart patterns, and levels of support and resistance.
Price action analysis is a tool used by traders to find trading opportunities based on price changes. For instance, a trader would watch for a breakthrough from a trend line or a resistance level, which suggests that the price may rise further.
As crypto trading can be a lucrative but risky endeavor, it’s essential to make informed decisions. To do so, you need to grasp the notion of technical indicators.
Technical indicators refer to the tools that perform market analysis in order to detect trends and potential opportunities. Here are some of the most important ones.
Moving averages. One of the most popular and straightforward technical indicators are the moving averages. They determine an asset’s average price over a predetermined time frame — 10, 20, or 50 days, for example — and are employed to spot market trends.
Moving averages can be used by traders to locate points of support and resistance as well as possible price breakouts.
Relative Strength Index (RSI). The RSI refers to a momentum indicator that gauges how strongly the price of an asset moves. It is used to identify whether an item is oversold or overbought and oscillates between 0 and 100.
The RSI can be used by traders to spot possible buy or sell signals as well as to validate trends picked up by other technical indicators.
Bollinger Bands. In order to form upper and lower bands around the price of an asset, Bollinger Bands, a volatility indicator, employ a moving average and standard deviation. Traders can use the bands to detect potential price breakouts or reversals since they enlarge and contract in response to market volatility.
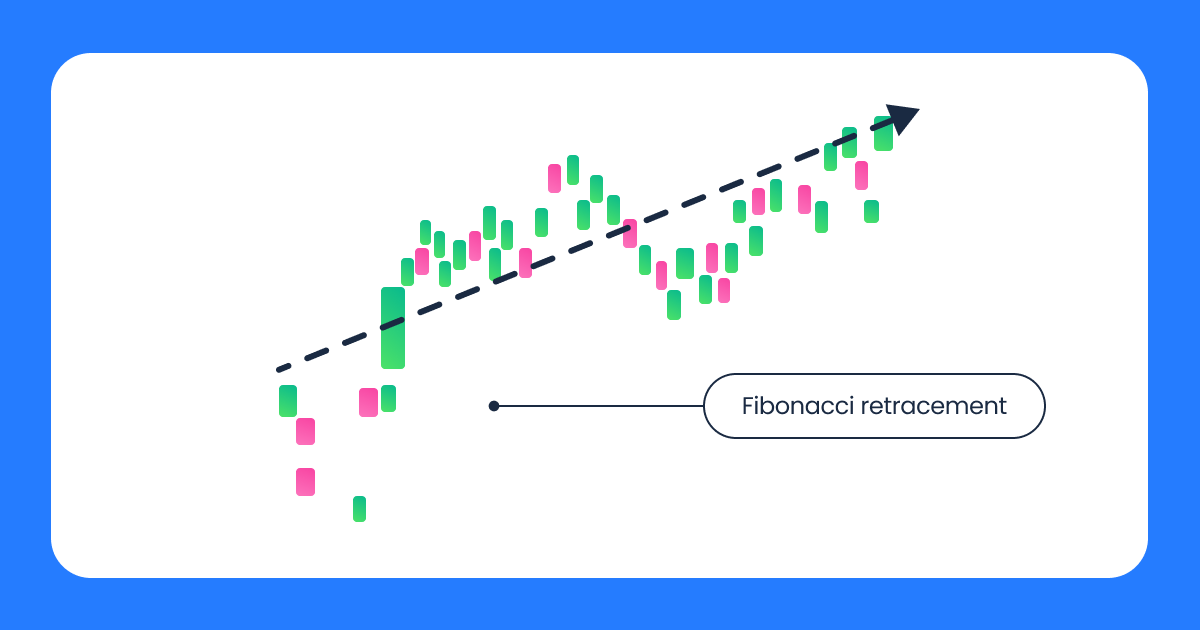
Fibonacci retracement. A technical analysis tool called Fibonacci retracement uses horizontal lines to represent areas of support or resistance at crucial Fibonacci levels prior to a market move. This tool is used by traders to locate probable levels of support or resistance as well as potential entry and exit points.
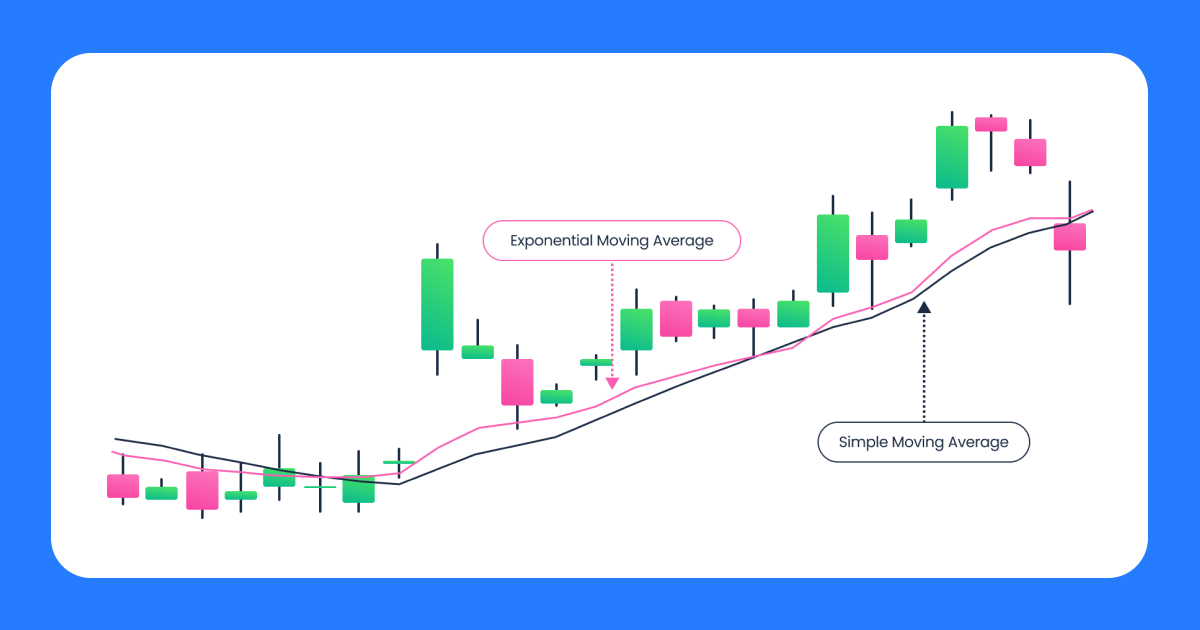
Reading crypto chart with moving averages is a common technique that traders use to spot market trends and probable reversals.
The simple moving average (SMA) and the exponential moving average (EMA) are among the most frequently implemented types. The EMA offers greater weight to recent price data than the SMA, which is determined by averaging an asset’s price over a predetermined period of time.
Traders frequently combine two moving averages with various time periods to use moving averages to identify trends.
A trader might, for instance, utilize a 50-day and a 200-day SMA. When the 50-day SMA crosses over the 200-day SMA, it is seen as a bullish indication, suggesting that the price will probably rise further.
On the other hand, it is regarded as a bearish indicator when the 50-day SMA crosses below the 200-day SMA, signaling that the price is likely to continue falling.
Moving averages are often used by traders to identify future market reversals. Searching for a “death cross” or a “golden cross” is a typical tactic.
A potential bullish reversal is indicated by a golden cross, which happens when the shorter-term moving average crosses above the longer-term moving average. A death cross, which denotes a potential bearish reversal, occurs when the shorter-term moving average crosses below the longer-term moving average.
For traders wanting to make educated judgments in the cryptocurrency markets, support and resistance levels are two key concepts in technical analysis.
To implement support and resistance levels in crypto chart reading, you may want to follow the steps below.
Determine the levels of support and resistance. You can implement historical price data to pinpoint critical levels that a cryptocurrency’s price has frequently retraced or struggled to surpass.
To find probable support and resistance levels, you can also employ technical indicators like moving averages, trend lines, and Fibonacci retracement levels.
Identify the degree of support or resistance. A price level’s likelihood of strength increases with the number of times it has served as support or resistance. To determine a level’s strength, you may also take a look at the amount of trading activity.
Make trading decisions based on support and resistance levels. Once you have determined the important support and resistance levels for a specific cryptocurrency, you can use this knowledge to guide your trading choices.
For instance, if a cryptocurrency’s price is approaching a significant support level, you might want to consider buying because the price is likely to increase again. On the other hand, if the price is moving toward a significant resistance level, you might think about selling because the price will probably find it difficult to overcome it.
Recognize possible breakout opportunities. Although support and resistance levels can be helpful for forecasting market moves, they are not always accurate.
When the price of a cryptocurrency crosses through a resistance level, it could signal a potential trend reversal and a buying opportunity. Likewise, if the price of an asset breaks through a support level, it might signal a possible trend reversal and a chance to sell.
You can’t become a pro at reading crypto charts overnight, as this skill takes time, effort, and practice, as well as to follow some tips and tricks.
Before beginning to interpret charts, it’s crucial to have a solid grasp of the fundamentals, such as candlesticks, price trends, and technical indicators.
Next, you need to choose the right time frame.Your decision-making might be strongly impacted by the time frame you select for your chart study. Long-term investors frequently use charts with longer time frames, whereas short-term traders typically use charts with shorter time spans.
Furthermore, you shouldn’t use only one indicator as it can’t give you the entire market picture. To gain a more accurate picture of the market, it’s crucial to combine several indicators, such as moving averages, RSI, MACD, and Bollinger Bands.
Don’t rely only on charts. Charts may offer insightful information about the market, but they shouldn’t be the only factor you take into account when choosing an investment. It’s critical to keep up with news and events that could affect the market.
Be aware of market volatility. Since cryptocurrency markets may be very unpredictable, it’s crucial to have an effective risk management plan in place. Always take your risk tolerance into account when placing stop-loss orders to reduce possible losses.
Practice and analysis are key. Learning how to read crypto charts is a skill which requires a lot of experience. Keep a trading journal to write down your observations and evaluate your trades to spot patterns and fields for further improvement.
Keep yourself updated with new charting resources and tools. For reading cryptocurrency charts, a variety of tools and resources are available. Stay informed about new innovations and features that might guide your trading choices.
And remember, should you ever get stuck and in need of a helping hand, don’t hesitate to reach out to us at Veli.io.
Latest Articles
Penning acquires Veli’s wealth-management business to launch Penning Wealth Veli’s crypto wealth...
Veli Won Best Startup Award by Plug and Play 🏆 Thanks to...
Veli Partners with DEC Institute to Equip Finance Professionals for the Future...