Penning acquires Veli’s wealth-management business to launch Penning Wealth Veli’s crypto wealth...
The cryptocurrency market has experienced exponential growth both concerning revenue and widespread adoption as an asset class. As a result, this expanded one’s options for portfolio diversification. Moreover, it also boosted the fundamentals that make up the options for trading or investing for both brokers and investors equally.
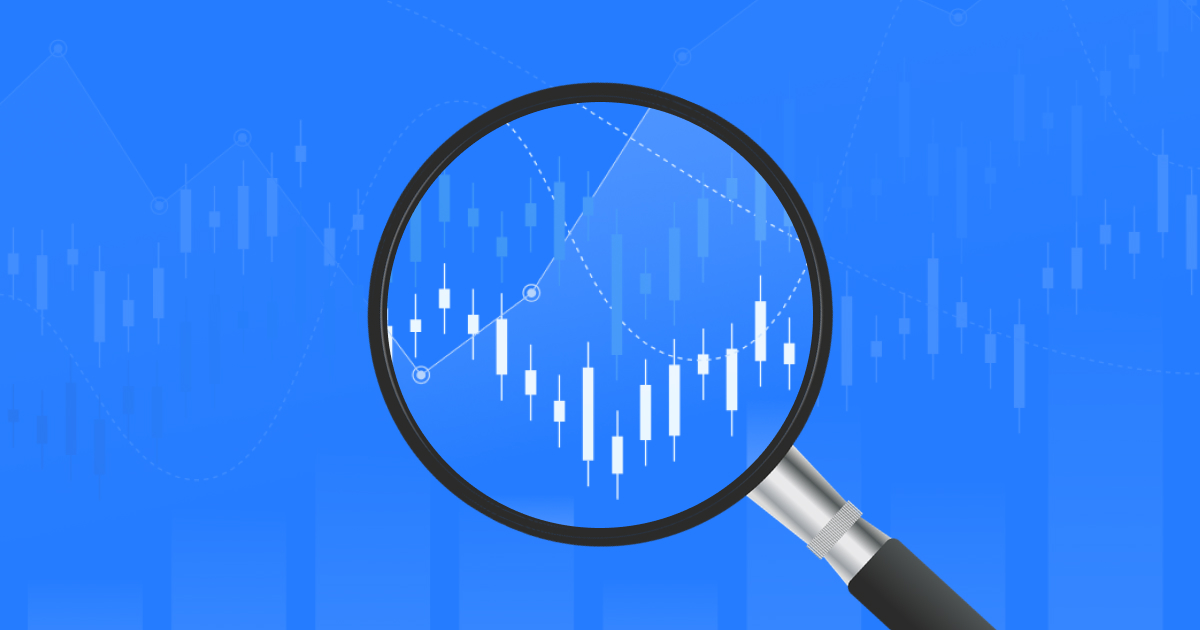
The first rule of crypto is to do due your due diligence prior to investing a certain amount of money in a token. This step is crucial and should never be skipped. Given the volatility of cryptocurrencies, it can be challenging to understand how the market is performing, but it’s essential to grasp this factor when conducting research. The answer lies in reading crypto candlesticks.
Candlesticks emerged in Japan in the 1700s, much longer before the Western world created the bar and point-and-figure charts. A Japanese man by the name of Homma found that, though there was a correlation between the supply and demand of rice and its price, trader emotions had a significant impact on the markets.
Candlesticks took nearly two centuries to achieve global popularity and acceptance, with the western world not adopting them until 1990. Nowadays, they are the most popular charting style in the majority of not only financial but also cryptocurrency markets. But what do candlesticks mean in crypto?
In simple terms, candlesticks are a technical tool that points out the market sentiment, i.e., the emotions of traders. This is achieved by implementing different colors to graphically depict the magnitude of price changes. The traders utilize candlesticks in order to make trading decisions according to recurring patterns that aid in predicting the near-term price direction.

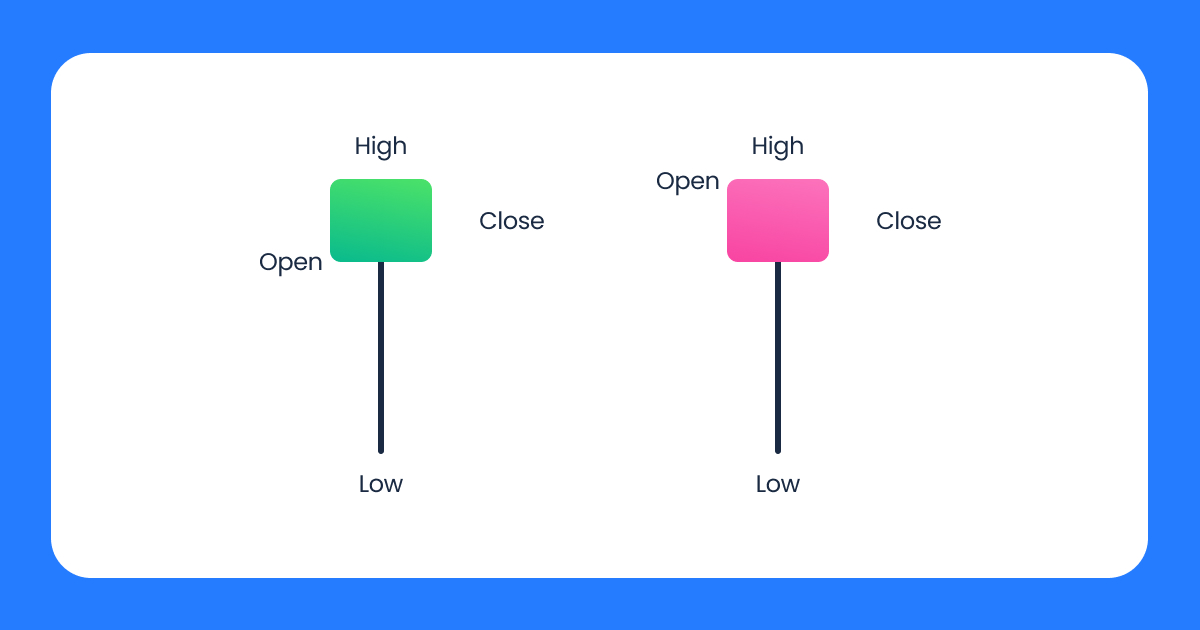
If you’ve ever glimpsed at a crypto chart, you might have noticed that a candlestick comprises two main parts — the body and a wick. Both these are vital and should be observed when it comes to reading crypto candlesticks.
The candlestick’s body is a thicker bar, and it shows the opening and closing prices of the asset being charted. When the candlestick body is green, it typically indicates a price increase for that time frame on charts. On the other hand, a red candlestick body denotes a decrease in price.
The wick is a thinner bar on the candlestick. It depicts the highest and lowest price points during the particular time period that is covered. In the majority of chart configurations, the color of the wick is identical to the body color.
One aspect of technical analysis, known as candlestick interpretation, involves understanding the potential implications of candlestick patterns in the context of a particular asset or market conditions. This is a trading technique whereby investors try to use past price movements to spot trends and potential future opportunities.
It’s expected for novice traders to encounter a common problem with technical analysis: how to read candlesticks in the crypto market? Worry not, we at Veli.io got your back. These are some of the indicators to look for:
However difficult they might be to grasp in the beginning, candlestick charts provide much more information than a mere line chart. Candlesticks are an essential tool for price action because they help to record specific information about the price, such as the open, close, high, and low for a given time period.
When reading crypto candlesticks, short-term traders (i.e., those operating in short time frames) occasionally concentrate on a single candle. As a novice, learning about “one-candle signals” can be a helpful exercise, as they provide useful insights into market trends. These signals consist of four typical patterns, including candles with long upper or lower wicks, doji candles, and umbrellas.
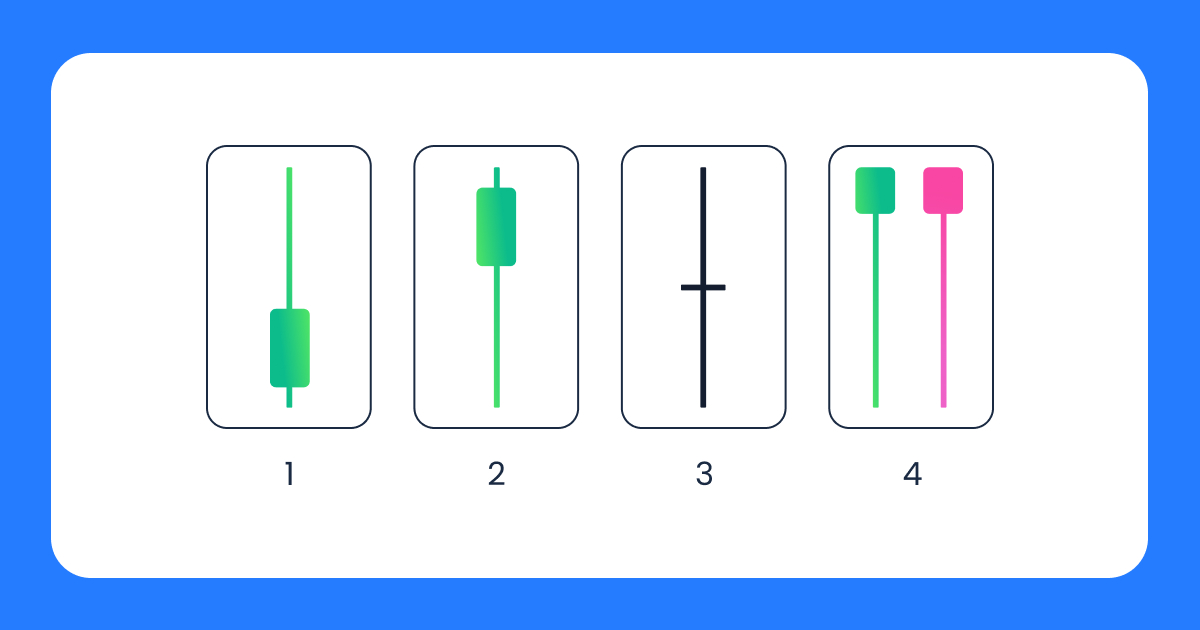
A long upper wick may denote a bearish trend (candlestick 1 in the picture). This further implies that investors are seeking to sell their assets and take a profit. The strength of an indicator is directly proportional to the wick’s size — the longer the upper wick, the more positive a signal is. On the other hand, a long lower wick indicates a bullish trend (candlestick 2). The investors want to buy assets, consequently driving their prices up. Again, the longer the lower wick, the stronger the signal is.
Due to the identical open and close values, a doji candle lacks a body (candlestick 3). These may typically indicate uncertainty in the market and a potential price reversal that might be coming. The name of doji crypto candlesticks originates in the 18th century when Japanese rice merchants used candlestick charts for the first time. The term “doji” is derived from the Japanese word for “same,” as the open and close prices being almost identical is a rare occurrence in trading.
Umbrellas comprise a significantly long bottom wick (candlestick 4). Red umbrellas, known as hammers, frequently indicate there is significant purchase activity of the asset. As a result, there is a possibility that the price will move up in the near future. In contrast, green umbrellas and their sinister moniker — hanging men — suggest that traders are ready to sell and reverse the uptrend.
It’s crucial to remember that one-candle signals can indeed be a valuable cue. However, a precise interpretation of the market requires comprehension of the broader context.
Cryptocurrency buyers often speculate whether the price will go up or down, making candlestick patterns that suggest upward or downward trends particularly interesting for traders who constantly scan the market for bullish or bearish signals.
In terms of technical analysis, a bullish candlestick pattern appears following a series of price decreases and before a string of price rises. On the other hand, a bearish candlestick pattern appears at the peak of a rising price chart, signaling the beginning of a price decline.
Bullish chart patterns involve several types of crypto candlesticks: the hammer, bullish engulfing, piercing line, morning star, and three white soldiers. Identifying them in charts can indicate an uptrend in the current cryptocurrency market.
Identifying the hammer candlestick pattern is relatively easy based on its appearance. Resembling an actual hammer, this pattern comprises a lengthy lower wick at the bottom of a candlestick. Typically, the body is small and has little to no wick at the top. The color of a hammer can be red or green.
The hammer pattern, when interpreted, may signal a substantial shift in the trend and an imminent price surge. This pattern illustrates robust selling pressure during the time when buying pressure regained control over the price movement.
Do note that the hammer has its inverted variant. The red or green inverted hammer has a long wick above instead of below the body. It suggests the possible start of an uptrend, following the end of a downtrend, suggesting that buyers may soon dominate the market.
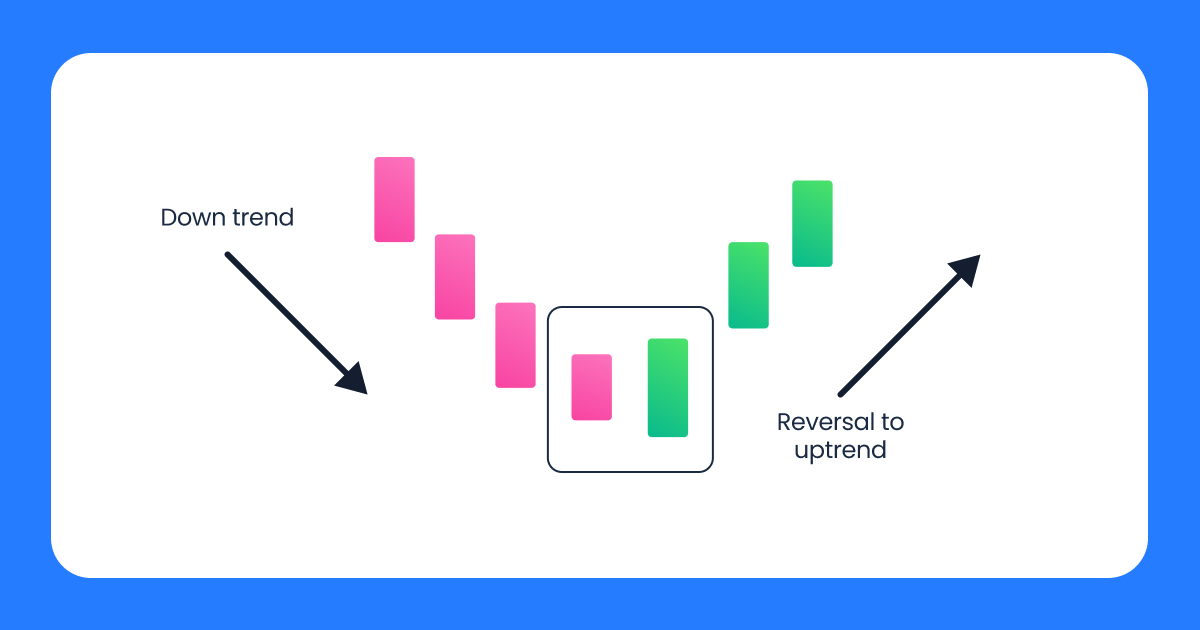
This crypto candlestick pattern consists of two candlesticks appearing at the bottom of a downtrend. The first candlestick is red (bearish) whereas the second one is green (bullish), engulfing the red one. The pattern portends increasing purchasing pressure and the start of an uptrend since buyers are likely to push the price up.

The piercing line comprises a long red (bearish) candle followed by a long green (bullish) one that appears at the bottom of a downtrend. There is a break between the closing and opening prices, where the closing of the bullish candle is more than halfway up the body of the bearish candle.
The pattern indicates that the start of the period appears to be very bearish. Nevertheless, the buying pressure rises throughout the candle, suggesting there’s an interest in purchasing at the current price.

The morning star crypto candlestick pattern includes three distinct candles in a downtrend. The first candle is long and bearish; the second one, with a very long wick and a short body, closes below the prior closing price; long and bullish. The third candle closes above the midpoint of a bearish candle.
The morning star indicates that the current trend is waning, which is frequently verified by the third candle that begins an uptrend.
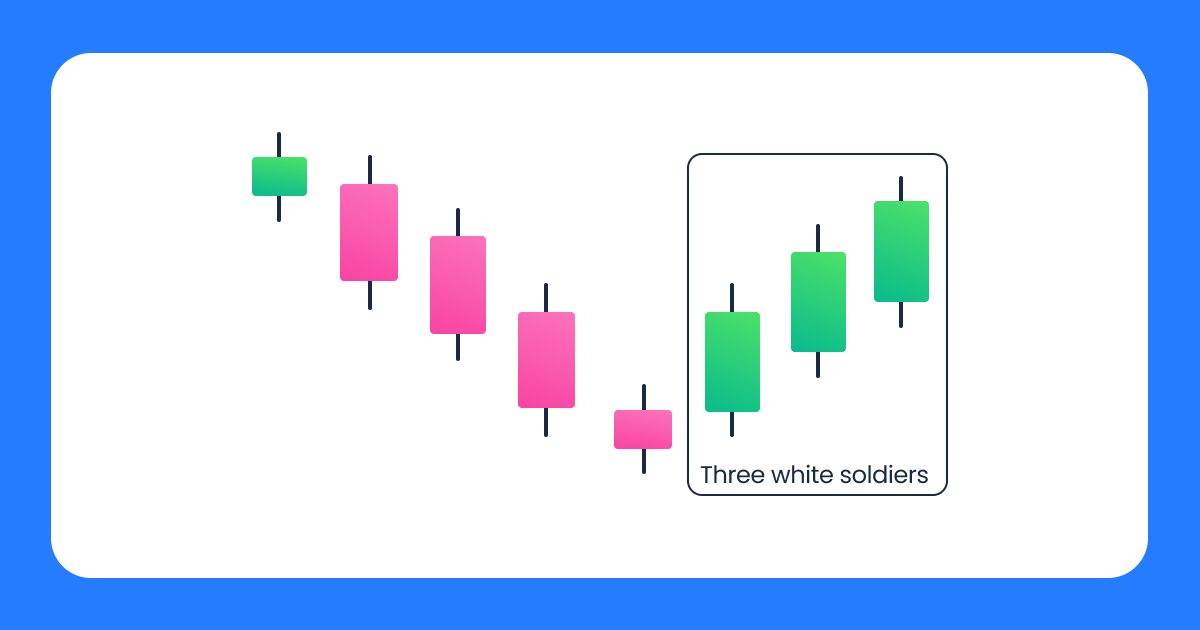
Three white soldiers comprise three green candlesticks with a small or non-existing wick. This pattern suggests that there is intense purchasing pressure pushing the price up and may even portend an impending price reversal. The size of the wick is directly proportional to the strength of the pressure — the bigger the wick, the stronger the buying pressure.
Now that you’re familiar with reading bullish crypto candlesticks, the time has come to master the bearish ones. As a reminder, bearish candlestick patterns occur at the peak of a price increase, indicating the start of a price drop.
Here we can differentiate between the hanging man, the shooting star, the bearish engulfing, the evening star, three black crows, and the dark cloud cover.
The hanging man is a bearish counterpart of the hammer. With a tiny body and a long lower wick, it typically develops at the end of an uptrend. It comes in red and green variations, indicating the uptrend is weak. Considering this, traders commonly interpret it as a selling signal.
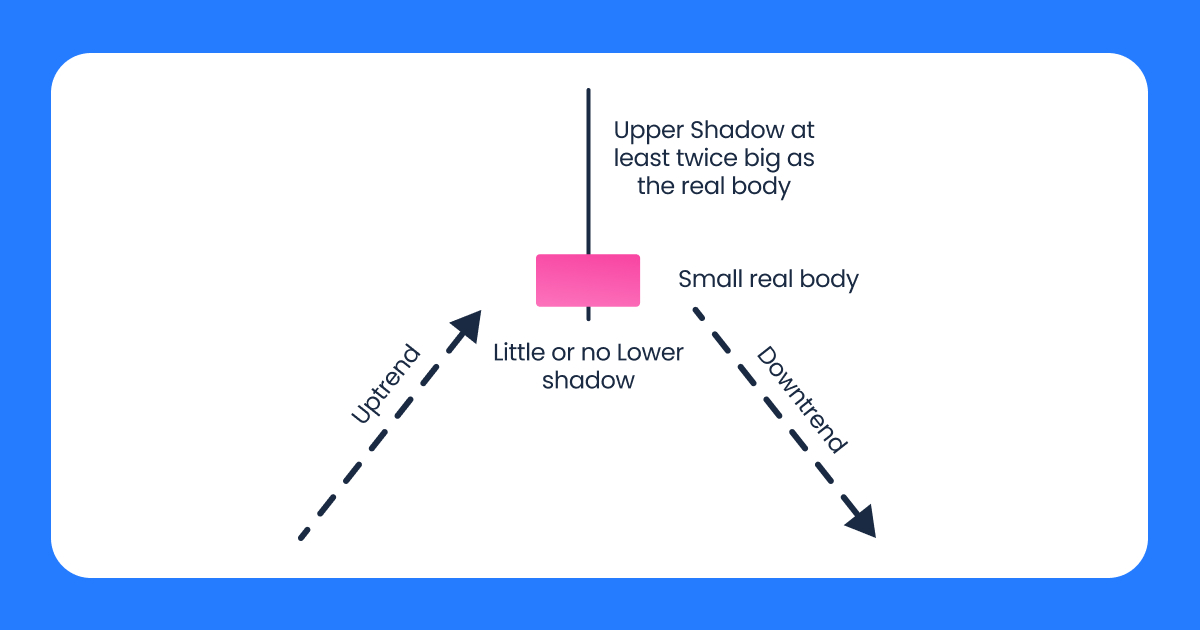
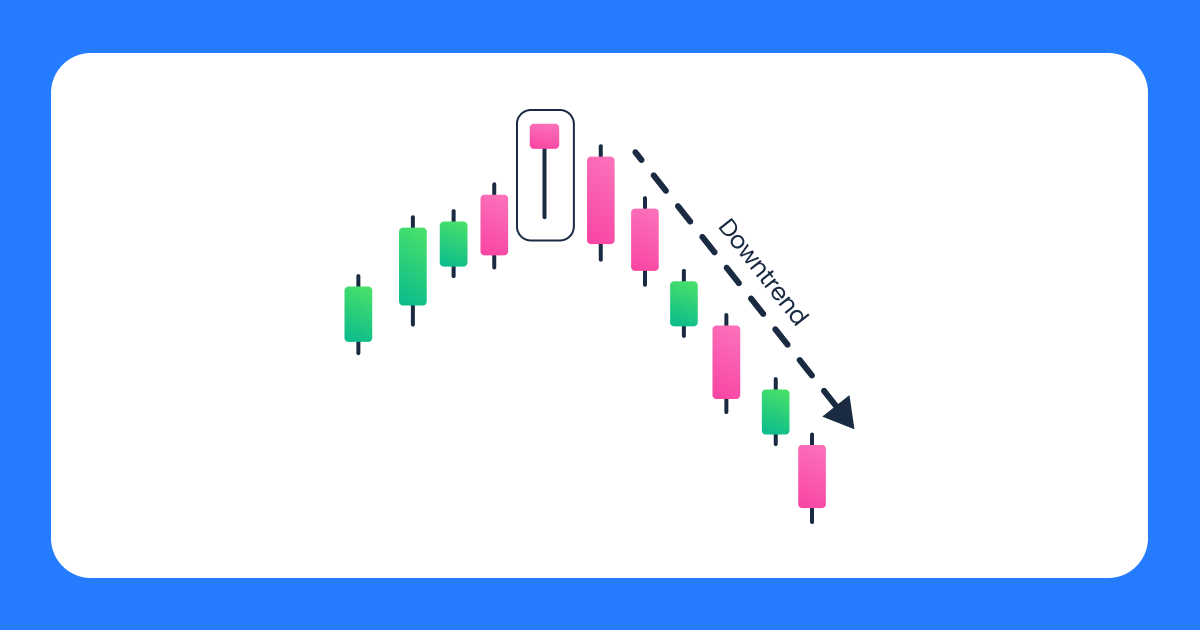
One candlestick with a small body and a long upper wick characterizes this crypto candlestick. This pattern appears at the peak of an uptrend, as opposed to the strikingly identical inverted hammer.
The shooting star pattern indicates a potential price drop after a significant upward movement. This pattern is frequently regarded as a bearish reversal indicator.

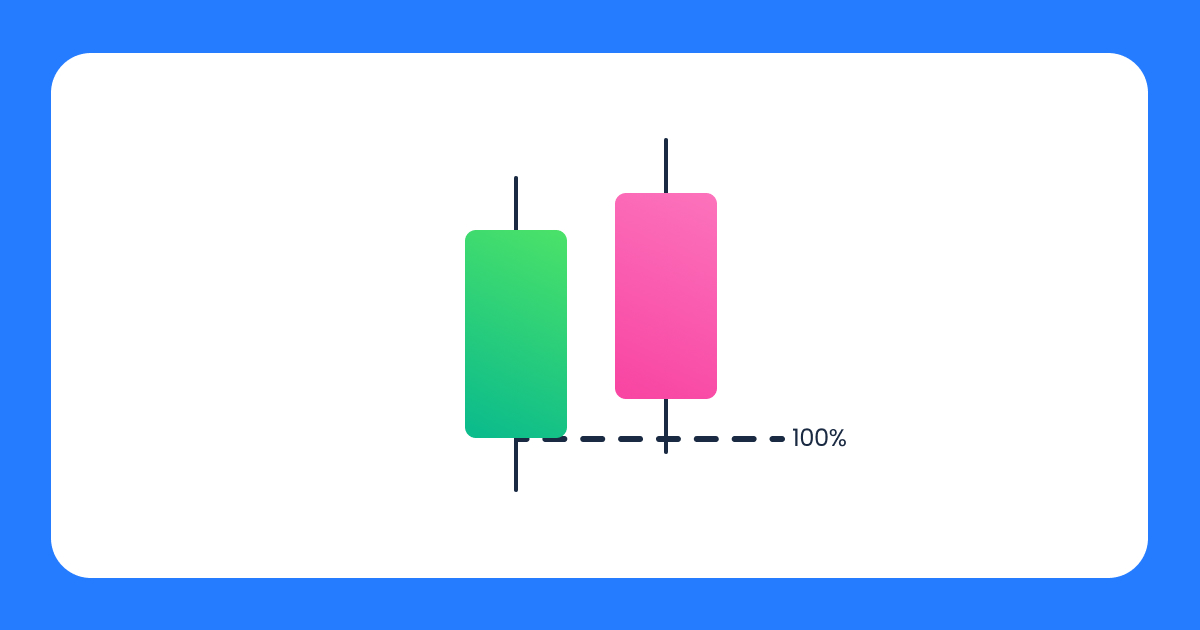
This pattern comprises two candlesticks — the green (bullish) and the red (bearish) one that engulfs the green candlestick. The bearish engulfing appears at the peak of an uptrend, indicating a growing selling pressure and the start of a possible downtrend.
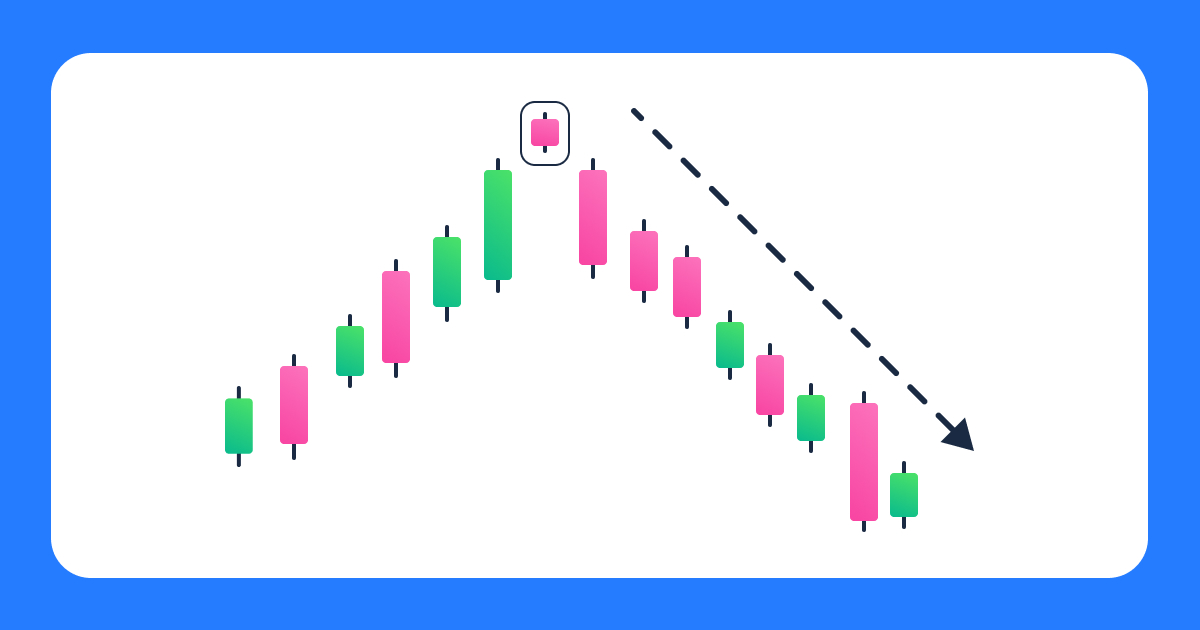
The counterpart of the bullish morning star, the evening star is composed of three distinct candles that are in an uptrend. The first one is long and bullish, while the second one has a short body and extremely lengthy wicks. Long and bearish, the third candle closes below the first candle’s midpoint.
The pattern indicates that the trend is waning as traders are selling their positions. The confirmations appear in the third candle, which frequently launches a downtrend.

Reading this crypto candlesticks pattern is not particularly difficult, as it can be recognized by three red candlesticks within an uptrend. Both the second and third candles open in the body of the first one and then close below it. All three candles have a small or non-existent wick.
Three black crows indicate an intense selling pressure that pushes prices lower and may signal an impending price reversal.
This pattern is composed of a red candle opening above the green candle’s ending price, then closing below the midpoint of the candle. Occurring in an uptrend, this pattern typically creates a new high.
The dark cloud cover may suggest a pullback or the end of the present uptrend. Traders frequently interpret this pattern as a selling indication in both situations.
Now that you have a good understanding of what candlesticks in crypto are, you’re ready to start practicing reading candlestick charts. However, before you begin, it’s important to keep a few significant basics in mind.
Two axes can be observed on a candlestick chart. The vertical one stands for the price or exchange rate between two cryptocurrencies, while the horizontal one stands for the behavior of the price over time. Secondly, price movements are divided into time intervals, each of which has four data points. Those include the opening and closing prices, as well as the high and the low price.
Now, onto the reading crypto candlesticks chart.
Though it’s not written in a stone, a candlestick chart is typically interpreted from left to right.
Grasping how to read the chart is not extremely difficult, but there still is a learning curve involved in chart analysis. For a better understanding, check out the chart below.
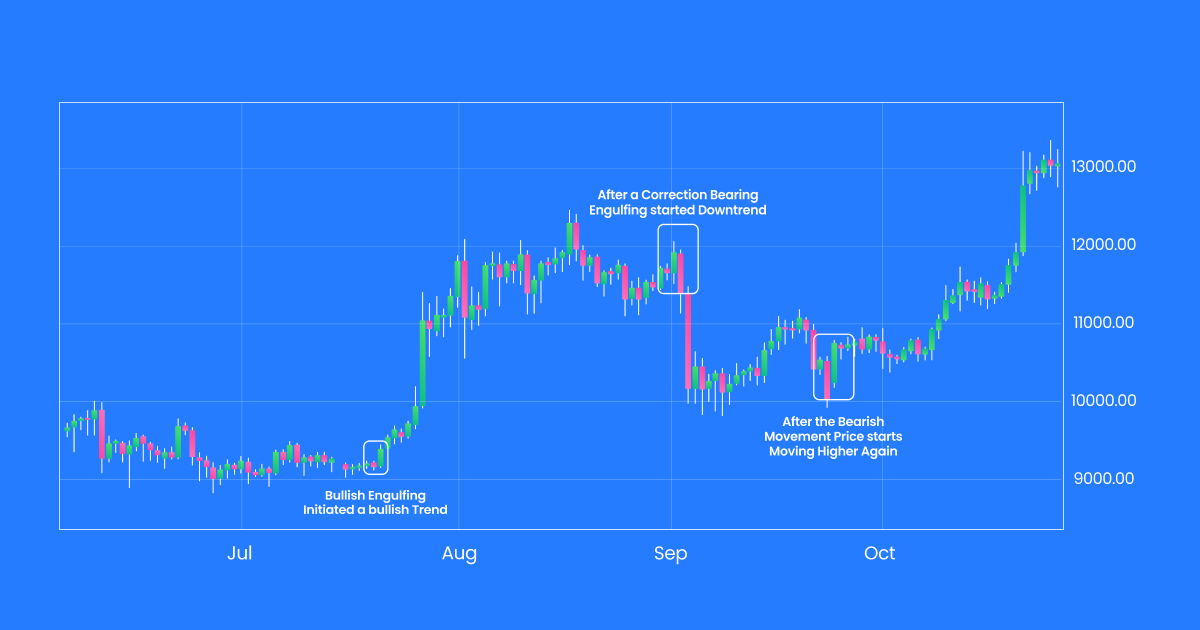
The chart displays the daily trends of the biggest cryptocurrency, Bitcoin (BTC). Its price began to advance with a bullish engulfing pattern. Later on, the trend shifted into a corrective downward motion. After the previous bullish engulfing, the price continued to move higher and formed another one, resulting in a new high.
Crypto candlestick analysis can be a good place to start if you’re new to crypto investing because it will allow you to gauge the likelihood of price changes. Every candlestick design describes the market sentiment and actions taken in the market. Being the simplest indicators to find, candlesticks can provide more information about price movements, particularly when used in conjunction with other technical analysis indicators.
Even if you are an experienced cryptocurrency trader, it is not recommended to rely solely on candlestick patterns as a trading indicator. This is particularly the case if you begin trading in higher volumes. The reason behind this is the fact that candlestick patterns are not perfect predictors of future price movements. The market has often moved in the opposite direction of the patterns predicted, despite their reliability.
It is important to remember that past performance does not necessarily guarantee future success, as it is often reiterated. By combining other strategies with candlestick patterns, you’ll be able to make the most out of crypto trading.
Lastly, it’s important to keep in mind that cryptocurrencies are highly volatile, meaning that their value fluctuates frequently. Though this might be a huge earning opportunity, it poses a significant risk of losing your funds if you address crypto carelessly. Therefore, conducting thorough research and due diligence is essential to make informed trading decisions and maximize profits.
Furthermore, detecting trends and patterns in candlestick charts can be overwhelming for novices. If you need any assistance, don’t hesitate to reach out to us at Veli.io.
Latest Articles
Penning acquires Veli’s wealth-management business to launch Penning Wealth Veli’s crypto wealth...
Veli Won Best Startup Award by Plug and Play 🏆 Thanks to...
Veli Partners with DEC Institute to Equip Finance Professionals for the Future...